We are thrilled to announce that we have been awarded the Organisational Excellence Award at the 2024 Office of National Statistics (ONS) Research Excellence Awards. This accolade recognizes DRAGoN’s significant contributions to developing new datasets, tools, and innovative approaches that are transforming UK data services.
Of particular note, DRAGoN has excelled in its work with sensitive data, setting best practices and standards for Trusted Research Environments—secure digital spaces critical for research that informs public policy.
Led by Professor Felix Ritchie at the University of the West of England, DRAGoN brings together interdisciplinary expertise and spearheads projects that are reshaping how data is managed and used. Here are some of the outstanding projects that showcase DRAGoN’s impact:
Wage and Employment Dynamics (WED): Led by Damian Whittard with support from Van Phan, this project combines data from across government to create a robust, unified dataset. Funded by ADR UK
Semi-Automated Checking of Research Output (SACRO): Led by Jim Smith, with support from Felix Ritchie, Lizzie Green, and many others, this project streamlines data service processes to improve efficiency and reduce stress for output checkers. Funded by Dare UK
Future Data Service Fellowships: Providing expert guidance and advice to help shape the planning of future data services and infrastructure in the UK. Funded by Economic Social Research Council
ODYSSEY Project: Led by Lizzie Green with input from Hilary Drew this initiative maps career pathways for data service professionals and sets national standards for safe data access and output checking. Funded by Economic Social Research Council
National and International Training: DRAGoN has been instrumental in developing and delivering training programs to ensure the highest standards in data access and management. Funded by National Institute for Health Research
We extend our thanks to the ONS for recognizing our work and supporting these transformative projects.
For more information or to connect with us, feel free to reach out to the team—let’s continue advancing innovation in data research and governance together!
The DRAGoN team are bringing back our webinar series in 2024 that, as ever, take a deep dive into the world of data. From data philosophy to real-world data governance, we have a packed schedule of talks from academics and data professionals.
Our Webinars are online, free and accessible to all. If you would like to attend a webinar please register below so we can send a joining link!
Full list of Webinars –
6pm-March 13 Felix Ritchie and Elizabeth Green: Kicking Off the Series (* Date change due to technical difficulties*)
6pm-March 20 Pedro Ferrer Breda; DRAGoN PhD Student : Data Governance in LMICs
PhD student Pedro will discuss the realities of data governance in low and middle income countries (LMICs). He’ll also present his own work in this area. Register Here.
5pm-April 9 Nadya Purtova and Damien Whittard : Thinking of Data as an Economic Good
This time of year offers opportunity to reflect on the past year and look forward to the next. Here, we re blog our Wage & Employment Dynamics (WED) project blog. The WED project take this opportunity to discuss and reflect upon their 2023 achievements and look at how these can be utilised and developed on 2024.
As we step into the New Year, we take immense pride in reflecting on the milestones achieved within the Wage and Employment Dynamics (WED) project in 2023. This dynamic data linkage initiative has been the cornerstone of vital and compelling research, providing fresh perspectives on the intricacies of earnings and employment dynamics in Great Britain. Throughout the past year, the project has fuelled academic inquiry and driven the discovery of vital insights across diverse fields. From enlightening conferences to impactful publications, the WED project has enjoyed many successes this year. Join us in reflecting on some of the WED projects achievements from throughout 2023.
Research Publications
“When are wages cut? The roles of incomplete contracts and employee involvement“ suggests that managers avoid lowering nominal wages due to concerns about damaging morale and productivity; the research reveals that when employees feel involved in decision-making at work, they are less likely to retaliate against wage cuts
The WED team are proud to have released their ASHE-Census 2011 code files for open source use. This is an exciting development and the team look forward to seeing how valuable insights into earnings and employment dynamics in Great Britain are unlocked.
Check out this useful “Data Explained” document for more information on this valuable new dataset.
This year, the WED team supported the creation of 5 ADR UK funded PhD and fellowship projects using the WED project’s linked datasets, expanding their impact across diverse fields from green jobs to community care. You can read more about their research here:
In 2023 the team got access to 1% samples of de-identified HMRC PAYE and self-assessment records, corresponding to the ASHE population. These are valuable datasets in their own right, but will also significantly enhance analysis of ASHE data (and vice-versa). Much of the team’s data work this year has been taken up with understanding these large and complex sources, and wrestling them into research ready datasets. We expect provisional versions of these to be available in Spring 2024.
Growth and 2024
Looking towards 2024, the WED project is poised for a new phase of growth and innovation. In the coming year, the project will continue with its ambitious plans to further enrich these powerful datasets by establishing links with HMRC data. This linkage aims to expand the reach of the project and contribute to the creation of the ever richer ‘wage and employment spine’. The team will continue to support the ever expanding community of data users who continue to unlock valuable insights into the complex landscape of earnings and employment dynamics in Great Britain. We look forward to sharing our progress with you along the way.
Don’t miss out on our up and coming webinars that dive deep into crucial topics like – Data protection during war, governance of confidential research data, and effecting change in healthcare settings.
Be sure to sign up now to reserve your spot! Learn from and engage with subject matter experts on issues that impact us all, expand your knowledge and gain new perspectives and sign up to join in the webinars today. This blog post gives details and sign up links for each webinar.
The webinar schedule is as follows, and you can find out more about each webinar below.
Research and policy development on the governance of confidential research data is dominated by the work of academics and government agencies based in high-income countries (HICs). This leaves three quarters of the world’s population faced with a corpus of theory and good practiced guidelines which, although robust and well-established, makes little or no reference to the specific circumstances of low- and middle-income countries (LMICs). It may be that the data governance models developed in LMICS may be easily transferable to other contexts (there is some evidence, for example, that human-centred training adapts well), but in general there is little or no examination of this issue. There is however a large demand; a recent announcement of a training course in data governance for LMICS was 10x over-subscribed within the first two weeks of launch.
Following from this gap, DRAGoN has started a project on the governance of confidential data for research use in LMICs. DRAGoN hosted a symposium on data governance in LMICs aimed at building a network for discussion of solutions of data governance challenges in LMICs. The output of this symposium was presented at a UNECE conference in late September.
Additionally, this project includes a PhD thesis by Pedro Ferrer Breda, which consists of a case study of Mexico’s INEGI (national institute of statistics and geography) and INSP (national institute of public healthcare) to understand data access decisions in Mexico, supported by Natalia Eugenia Volkow Fernandez, INEGI’s director of microdata access.
This talk will describe this project’s current progress and explain future plans for the development of support networks for good governance of data for research use in LMICs.
Part of the team: Effecting change and sharing power in healthcare settings
In this talk, Dr Jessie Stanier and Dr Purtell discuss a recent paper from a project which explored perspectives from patients and researchers to rethink how patient stories were shared with executives at an NHS hospital trust. With a goal to develop a new narrative framework to help patients position themselves as part of the healthcare team, emphasizing shared roles and responsibilities between patients and practitioners.
Their talk will cover the outcomes of this collaborative project, including key support structures and obstacles. They will reflect on the significance of collective voice, accessibility, administrative support, and senior staff buy-in when working to truly integrate patient perspectives in healthcare systems, especially considering austerity measures and the COVID-19 pandemic and look at how their findings can influence relationships beyond those in the NHS.
Statistical Disclosure Control is an important process where statistical data is protected before being released to make sure that no identifying information is made publicly available. This is a large task that is often completed by several people. One of the primary methods of SDC is output checking. This is when outputs from data (tables, graphs, statistics etc.) are observed both by the initial researcher producing the outputs and a pair of output checkers associated with the data holders to ensure that the data can’t be extracted from the outputs in a way that would compromise anonymity.
Although there are rules that an output checker will look for when attempting to secure data, perhaps the most common of these is count thresholds; a measure that places a minimum limit on the number of observations that can be present in any cell of a table or count on a graph. This prevents someone who might have some knowledge of a participant in a study from working out the rest of their data. Typically, data holders will have a specific value below which data requires suppression.
Usually, this is enough to protect data with only a slight reduction in detail level. This can become problematic, however, when collected data refers to a minority demographic.
For example, in a hypothetical study, the researcher is surveying employees in order to observe career satisfaction. Of 500 employees surveyed, only seven identified as disabled, two of which stated that they are diagnosed with an Autism Spectrum Condition. By the rules of SDC, these results would need to be suppressed to protect the identities of those involved. However, when observing the data, it is clear that those participants who identified as disabled have a large reduction in work satisfaction compared to their peers The researcher wants to use these results to justify further investigation into this issue in the form of a large survey, specifically targeting this group but would struggle to support this properly in their paper while still concealing the suppressed data points.
This hypothetical demonstrates a difficult scenario where there is no clear answer. Suppressing the data would prevent any risk of disclosure of confidential health data but would potentially prevent to furthering of research into an under-represented group.
Data as a weapon
An argument for stricter protection of data is the potential harm that data can cause when weaponised against minority groups (Jan Trust, 2021). It is known that Data can have a potential risk when released, especially when specific minorities could be targeted by that data. This topic hit the headlines in July 2020 when postcode-level testing data was withheld from publication. There was concern amongst local councils that the higher prevalence of the COVID-19 virus in BAME communities would incentivise racially motivated discrimination against these groups. This line of thought would add caution to the collection and release of minority data in an attempt to prevent the fuelling of pre-existing stigmas.
Forbes defines four indications of Data weaponization (Murphy, 2020), all of which may have real consequences when used against minority groups.
1.) Creating Selfish Proof – The cherry-picking of data to serve as confirmation bias.
2.) The Dangers of Short-Termism – prioritising immediate results over long-term consequences.
3.) The Art of Manipulation – intentionally using data to profit in a way that harms the consumer.
4.) Reducing people to their lowest common denominator – defining a person by a behaviour or action out of context.
It‘s not difficult to see how all of these could be dangerous, especially when aimed at vulnerable individuals. So, when considering neurodiverse populations, many of whom face immense stigma in their day-to-day lives, it is important to turn a critical eye to what drawing attention to this group will achieve. Is this an area where neurodiverse people may have widely different experiences from the neurotypical population? Is this an area where neurodiverse voices have been historically undervalued? Or conversely, will singling this group out in particular unnecessarily place them at risk of data weaponization?
Data as a tool of representation
Accurate and detailed data about minority groups is vital to properly understanding the needs and experiences of those groups as well as making sure that they have space to fit into the tapestry of larger population observations.
A recent example of this is the questions surrounding sexuality and gender in the 2021 UK census(Moss, 2023).. For the first time in history the UK Census simply included one question on how the participant would define their sexuality, one on if their gender identity was the same as their sex assigned at birth (with the option to write in any non-cis-gendered identity) and one question asking if a married individual was married (or in a civil partnership) with a member of the same or opposite sex. While brief, and perhaps a little surface-level, this line of questioning provided an accurate look at the population level for the first time. Because of the collection of this data, areas with higher levels of LGBTQIA+ individuals can be identified, demonstrating the need for leaders of those local authorities to hold their LGBTQIA+ constituents in mind when acting in their role. While useful in gaining a basic overview of the number and location of queer populations in the UK, this data set does not gather much detail on the nuances of identity within these communities.
In comparison, the Gender Census , which attracted 39,765 participants in 2022, collects more specific data and a different approach to disclosure control. While the data holder does produce a full report of the data and trends observed when compared to previous censuses each year, the full data set is made available on the website. While each data entry is associated with a random participant number rather than any name or IP address, the survey does not apply cell suppression to any given information other than the country of origin (with a minimum count of ten). This allows data pieces with only one or two entries to remain in the public data set, acknowledging lesser-used identity words or pronoun sets and providing a more complete landscape of the language used by this community to describe themselves. However, this does mean that the issues that would be managed by output checking remains; a bad actor could find a participants full data set by searching for a known, rare response the participant had given. In this case the researcher addresses this by being explicit about how and why the data collected is stored and distributed and giving participants the option to have their data removed at any time if they are no longer comfortable with being involved in the research.
On the website for this survey, they have a tab dedicated to data protection where they speak in detail about their data procedures and their limitations. By acknowledging this openly, they are able to collect the much needed and high-quality data covering a large participant group.
The Case of Neurodiversity – An Autistic Example
When considering these issues in connection with neurodiverse populations, it’s important to acknowledge the history of exclusion this group has experienced within research. The autistic community have, for example, long been isolated from the researchers investigating their disorder (Milton, 2019). Autistic researchers and advocacy groups have been pushing for direct involvement in research as many autistic people (academics included) feel that there is a real disparity between current research and research that would actively be useful to the community (Loughran, 2020). Because of this, many autistic advocacy groups have adopted the slogan ‘Nothing About Us Without Us’.
Throughout both historic and current research, there has been a huge focus on developing a ‘cure’ for Autism Spectrum Conditions. The fact that the majority of the autistic community do not want a cure as they feel that it is impossible to separate their autism from who they are, a state of being they don’t believe is ‘wrong’ or requires any correcting has been ignored.
This primarily leads to two responses within the community: Autistic individuals who are resistant to and distrustful of autism research out of fear that their participation will lead to an attempt to un-consensually ‘fix’ them, and autistic people (often academics and researchers themselves) who actively fight to advocate for themselves and their community. They wear the label autistic with pride and seek to educate those around them as well as those in academia on what it is like to live as an autistic person.
Research into autism is needed desperately in many areas, from healthcare to education to employment. As of 2021, only 21.7% of autistic people were in employment (Cusack, 2021), the lowest of any disabled group. Further research into why this is the case could trigger social change that would benefit hundreds of thousands of autistic adults in the UK and have a positive rippling effect into UK society as a whole.
However, in order to help groups like these it is important that data collected on them is as detailed as possible and their data isn’t disregarded, even when they only appear in small numbers.
Solutions?
There is no one answer to this problem. The issue is complex and commands many strong, apposing arguments. This most appropriate response to this concern will likely differ on a case-by-case basis. However, here are two solutions that may be useful.
One could combine labels referring to specific conditions into larger group labels. Such as ‘Neurodivergent’, ‘Neurological conditions’, etc. This would allow more data sets to be grouped in a way that would aid in the prevention of data disclosure without removing the distinction entirely. This may be useful in some cases however has the risk of severally reducing the specificity of the research. By combining these labels into one larger category, it incorrectly assumes the individual groups within it have synonymous experiences and needs. It also has the downside of erasing the individual identities, many neurodivergent individuals take pride in their specific labels and seek to reduce stigmatisation around that language. This mirrors the conversation currently happening around the BAME acronym (UWE Bristol, 2022).
Another possible solution would be to collect specific data with direct informed consent from those involved. By having consent discussions with participants, especially those known to the researcher to be of a minority group, with honest explanations of the risk and granting them the opportunity to rescind participation in the research should they be uncomfortable with that risk, the researcher is able to collect and properly analyse the data on a minute scale. This would not remove the risk of disclosure, but would allow participants to be involved in the discussions around how to handle their data.This could lead to participants workshoping ideas with the research team to allow their data to be used in a way that is both specific and protective. A potential downside of this method is that it may deter some potential participants from being willing to be involved in the research, thus having a detriment to population size.
There may well be many other ways to face this issue, if you have any suggestions or queries, I would love to hear from you. You can reach me at: cara.kendal@uwe.ac.uk
References
Aspinall, P. J. (2014). Identifying key vulnerable groups in data collections: vulnerable migrants, gypsies and travelers, homeless people, and sex workers. Center for Health Services Studies, University of Kent, 18.
Kapadia, D. (2021, February 18). Represented yet excluded: How ethnic minority people are counted in national surveys. Retrieved March 1, 2023, from https://blog.ukdataservice.ac.uk/represented-ethnic-minority-people/
We are partnering with Eastside Community Trust to bring you a night of short, attention grabbing talks followed by a Q&A. Free and open to all at Easton Community Centre.
What’s the Big Idea? Eastside Community Trust and University of West of England present four attention – grabbing, interesting talks, with a Q&A sessions throughout.
Location
Easton Community Centre Kilburn Street, Easton, BS5 6AW
Date and time
Mon, 27 March 18:30-19:30
Registration
This event is free but we ask that you Register Here so we can accommodate for numbers.
Why inflation? Some economists believe full employment and wage demands are driving inflation, others the supply chain, the war in Ukraine, OPEC. So what is the real oil so to speak and what just smoke and mirrors. We Shall discuss….
Dr Julie Woodley’s research is in medical ethics. Her presentation with focus on the controversial topic of human head transplantation. Should we allow this technique to go ahead, or should it remain science fiction? And how can medical ethics help us to decide?
Sam will be delving into air quality monitoring In Answering questions like ‘What makes a good source of data?’ and ‘How can you get a hold of your own air quality sensor?’’
Your data and you. What does Tesco know about you?
What do companies like Tesco know about you through the data they gain from their loyalty schemes such as Clubcard points? How valuable is it? Where does that data go? Felix will explore how what how and where you shop tells your supermarket a lot about you – but also why this shouldn’t necessarily be a cause for concern.
BCEF member Dr Danielle Guizzo Archela is an associate researcher of Autonomy, an independent, progressive think tank which aims to address the uncertainty of work in the modern era.
Autonomy is comprised from a multidisciplinary array of researchers and experts in political economy and critical theory. On Friday 1st February 2019 Autonomy launched a new policy report on a shorter working week. “The shorter working week: a radical and pragmatic proposal” outlines the case for a shorter working week and shows that there is no positive correlation between productivity and the amount of hours worked per day. The report has received praise from a number of politicians and academics.
“This is a vital contribution to the growing debate around free time and reducing the working week. With millions saying they would like to work shorter hours, and millions of others without a job or wanting more hours, it’s essential that we consider how we address the problems in the labour market as well as preparing for the future challenges of automation.” John McDonnell, Labour Shadow Chancellor
Our conventional working week and the idea of a compromising work-life balance in the UK has been debated in the media for some time. Last year in New Zealand a landmark trial of a four-day working week concluded it an unmitigated success and the discussion on how a four-day work week could be implemented long-term was opened up.
The Autonomy report has already been making headlines, and the idea of working “part-time” being standard, rather than just an option for those who can afford it, has been very popular. Below are just a few of the recent articles on the report.
There has been a lot of interest in measuring disadvantage over the past 20 years in the UK even if this has not always been matched by government responses. The fifth iteration of the English IMD is to be reviewed over the next 12 months. Clearly disadvantage is a complex thing and can be represented in many different ways. As a geographer (or someone who periodically claims to be a geographer hiding in an Economics Department) I am particularly interested in area-based assessments of disadvantage. I know such measures are problematic but what indicators are not? I recently have had the opportunity with colleagues to review how the English Indicator of Multiple Deprivation works on behalf of Power to Change (see https://www.powertochange.org.uk/) and this is a short blog that captures some of the thinking that came out of that work (any errors or misinterpretations are all my/our fault and not necessarily shared by anyone at Power to Change).
So, the English IMD is a second-generation indicator of area-based deprivation that represents 7 ‘dimensions’ (or 10 sub-dimensions if you like) of disadvantage from worklessness to housing affordability, from health (mental and physical) to distance from your nearest post office. It is ‘second generation’ because it is not solely dependent on small area census data (as ‘first generation’ indices are/were) but is based on a range of small area administrative and census data from different sources within English government.
I am a fan. It is lovely. My colleagues in other European countries are jealous of it (the basic model is oft copied) – both because of its breadth of content but also because of our lovely regular statistically ordered lower super output areas (LSOAs) that sometimes get conflated for neighbourhoods. However, an indicator is a conceptual model of a real concept. As George Box pointed out – all models are wrong, but some [of the better ones] are useful. We and Power to Change were interested in posing the question of how useful is the IMD to Power to Change?
In particular, we were interested in how the IMD is used within a particular organisational context (Power to Change). We set up a set of dimensions to help us think about how an indicator (a statistical instrument ‘designed’ to perform a task) is constructed and deployed. We asked people in Power to Change how they used the IMD and what was their assessment of the strengths and weaknesses for what they needed to do: investing in community businesses that alleviate disadvantage in England. What struck us in these conversations was that the IMD was only being used in its top-line indicator format – what was being missed was the opportunity to use the IMD as an indicator system that can be moulded to the specific objectives of an organization.
We explored how to use the IMD as a system of indicators to shine a light on a specific objective: investing in community businesses. We compared spatial targeting at LSOA level for the top-line IMD indicator (the full 7 dimensional one) with the spatial targeting from a bespoke indictor bringing together the health and disability, education and qualifications and the geographic access to services dimensions. Power to Change has hypothesised that community businesses some of which provide local services may impact on employability (skills) and on the health of residents in the communities that community business serve. So, we constructed a focussed indicator from components of the topline IMD that focused only on geographic access to services, education and health (for details see Smith et al 2018). We compared how the focussed IMD indicator would spatially target the attention of Power to Change in comparison to the top-line IMD indicator with a particular focus on the city-region of Liverpool and the County of Suffolk as examples of areas of interest for Power to Change. We then mapped out the differences (using data and shapefiles obtained under a public licence) showing firstly the map of the top-line IMD indicator, secondly showing our ‘new’ indicator focusing on Power to Change’s priorities and thirdly what difference it makes in targeting. These maps are shown in Figures 1 (for Liverpool) and Figure 2 (for Suffolk). We have used the somewhat arbitrary threshold of 30% to indicate disadvantage (the most disadvantaged areas to be targeted) and compared the indicators.
Figure 1
The left-hand side map in both Figure 1 and Figure 2 shows neighbourhoods marked relative to the top-line IMD indicator where the deepest green areas are the most disadvantaged. In the middle map the same rule applies. The right-hand map in these Figures shows what difference it makes for these areas. In this right-hand map, the red areas are those that are marked as the most disadvantaged 30% under both indicators. The blue areas are ‘advantaged’ under both measures. However, the orange areas are marked as disadvantaged under the ‘better places’ indicator but not under the top-line IMD.
Figure 2
Given the greater importance given to access to services (albeit direct distance accessibility based on 2012 data), it is not surprising that Suffolk LSOAs become more disadvantaged under this measure. Thus, nearly half of Suffolk becomes ‘disadvantaged’ on this measure (30% most disadvantaged in England on this measure) than under the top-line IMD (more of Suffolk’s third map is coloured orange). Perhaps it is of greater surprise that the prioritisation of Liverpool changes little under the new formulation. Most of Liverpool’s neighbourhoods remain identified as ‘disadvantaged’ (marked as red in the third map along).
This is however, just a schema for moving resources around. It is an inevitable result of re-calculating the target IMD measure that some areas gain whilst others lose out (where resources are fixed). However, if areas in Suffolk gain whilst neighbourhoods in Liverpool do not lose out, then how would such a change modify the geography of disadvantage [under this measure] across England? Using the 30% figure as the threshold of disadvantage just under half a million fewer people would be designated as living in a ‘disadvantaged’ area. We did some cluster analysis of the ranking on the top-line IMD indicator and our suggested Power to Change indicator considering both how LSOAs clustered together (using forms of hot spot analysis) to capture how patterns of disadvantage form broad regions and secondly, we looked at the identification of outlier neighbourhoods (using the analysis of Anselin Local Moran’s I) to capture differences within these wider clusters.
Figure 3
On Figures 3 and 4 the LSOAs that are marked as red are ones than appear as advantaged (close to other advantaged areas). In these Figures we have a left-hand map that shows the clustering of indicator ranking in relation to Suffolk. The middle map shows the Getis-Ord clustering for England as a whole whilst the right-hand map shows the Local Moran’s I maps which show where areas are located as outliers in wider regions. Where there is red there is advantage and where there is blue there is disadvantage (from an area-based perspective). Yellow areas are mixed (any area’s ranking is not easily predicted from the ranking of its neighbours). It is also worth noting that the red and the blue areas are not necessarily all of the most disadvantaged areas – just areas that are close to others that are similarly ranked (whether high or low).
Figure 4
It is not surprising to see clusters or disadvantaged (blue) areas in England’s northern metropolitan areas, in the West Midland and in the extreme South West in Figure 3 that maps out the top-line IMD indicator. It is also not surprising to see the East and
North of London marked as deep blue although it is worth noting that the former Kent Coalfield areas remain marked as disadvantaged in blue. So, it is England to the south of the Wash to Severn axis as well as North Yorkshire that are marked as ‘advantaged’ regions under the top-line IMD indicator. The Anselin outlier mapping (right hand map) in Figure 3 points out the presence of disadvantaged LSOAs in advantaged clusters and of the presence of advantaged LSOAs in disadvantaged clusters.
Moving to the Power to Change indicator in Figure 4 we see a change in the geography that might be targeted (in this case by investment in community businesses). More rural areas in the East and South West of England become identified as ‘disadvantaged’. Areas in the East and North of London no longer become identified as disadvantaged in terms of the clustering on this measure’s ranking. There is a different dynamic – to be disadvantaged area in London is to be surrounded by advantaged areas. The East of England (including Suffolk) becomes identified with the cluster of disadvantage although there are clearly still advantaged area outliers in the sea of blue disadvantaged areas. Although there are disadvantaged areas in the advantaged region of London. It has to be stressed that this applies only to forms of disadvantage that flow from combinations of problematic educational, health and accessibility outcomes. There would be a case for an organisation like Power to Change to use a form of IMD that relates specifically to their core mission as a spatial guide to targeting rather than just using the top-line IMD indicator.
The aim of the exercise is not to rubbish the general top-line IMD. I am still a fan – it is still offers useful insight into the patterns of generalised area-based disadvantage across England. The English IMD is still useful to Power to Change in a general sense. However, the aim of this has been to draw to attention the fact that deploying the indicator system in the light of what is trying to be achieved makes better use of the IMD system. The East and North of London is clearly a region with many disadvantaged areas but if the aim of the exercise is to invest in community businesses that improve access to services, health and educational outcomes, there might be better areas on which to focus this specific form of investment. Whatever form of analysis we come up with to capture disadvantage there is always a set of political choices about how to share out public spending. However, the English IMD is more than just the top-line indicator and the top-line IMD was never intended to be the only way in which area-based disadvantaged was represented.
Although in this delicate dance of spatial targeting, the real answer is to invest more in welfare services. Perhaps that is one normative step too far?
If you want to read more about our work with Power to Change, please download the report we wrote for them (available from September).
Smith, I, Green, E, Whittard, D. and Ritchie, F. (2018) Re-thinking the indices of multiple deprivation (for England): a review and exploration of alternative/complementary area-based indicator systems. Final Report. Bristol Centre for Economics and Finance (BCEF) in the Bristol Business School at the University of the West of England (UWE).
By the researchers of the ‘Earnings gaps and inequality at work’ project, BBS
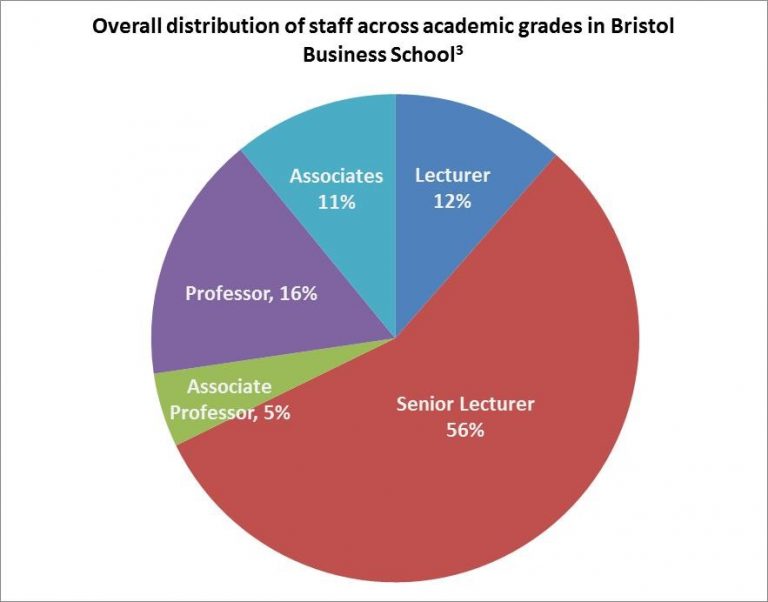
In compliance with new UK legislation, UWE Bristol published its own gender pay gap report in March 2018. Whilst recognising the need to do more to close the pay gap between women and men, that UWE achieved a gender pay gap of 13.15% has been portrayed as a sign of progress. The UWE figure is lower than the national average of 18.1% (ONS 2016)[1] and has decreased by 4.85 percentage points since 2003.[2] But if the current rate of progress is anything to go by it will be another 40 years before the gender pay gap at UWE is closed. In Bristol Business School[3] (BBS), 67% of academic staff at lecturer level and 53% at senior lecturer level are women compared with 44% and 43% at associate professor and professor levels respectively. That women are overrepresented at lower grades is not a sign of real progress, but rather that women struggle through career progression. It is then crucial to better understand what explains the gender pay gap and what actions are necessary to tackle gender discrimination at work.
Within academia, gender gaps manifest for various reasons including slower progression paths (Krefting 2003; Holiday et al. 2014; Winslow and Davis 2016). In BBS, women are well represented at the executive and management levels which might indicate specific barriers against academic promotion such as from senior lecturer to associate professor and above. A recent Times Higher Education article highlighted that one in three UK universities are going backwards on female professorships. Studies have also revealed discrimination in academic publishing. Women are less likely to push for first authorship when collaborating with men, and women authored articles face higher levels of scrutiny in the peer review processes (West et al. 2013; Hengel 2017). Women tend to apply for fewer external grants, although their success rate tends to be higher. In addition, women face disproportionate burdens in relation to career progression once they have children. Female academics face a motherhood citation penalty whilst having children appears to advantage men’s career progression. A recent study in the US showed that men with children were 35 percent more likely than women with young children to secure tenure-track positions. Men with children are also 2 percent more likely to secure these positions compared with women without children (Mason et al. 2013). There is quite some variation across disciplines in terms of gender discrimination with economics being particularly bad in terms of apparent gender imbalances in student enrolment and all the way through in academic careers (Ginter and Khan 2004; Goldin 2013; Tonin and Wahba 2014; Crawford et al. 2018).
The Gender Pay Gap is not about Equal Pay
The gender pay gap captures some of the outcomes of discrimination – for example, wage inequality, job segregation and differential progression – but it obscures others. More importantly, it tells almost nothing about the complex mechanisms via which societal norms, class, power relations, institutional structures, workplace practices, legislation, and individual attributes interact and reinforce gendered, as well as other types of discrimination. As explained in this Guardian’s video, the gender pay gap data does not reveal anything about equal pay, which is whether women and men are paid equally for the same type of job. Furthermore, research has shown that the allocation of workload, autonomy over one’s time use, the burden of pastoral care, and physical and emotional conditions of work are on average worse for women compared to male colleagues (Holliday et al. 2014; Stier and Yaish 2014). Even the ways in which women are assessed on the quality of their work are highly discriminatory. Women experience substantial negative bias in students’ assessments. Women in academia operate under workplace conditions that are stacked against them.
Inequality and mental health
There is increased understanding that inequalities within societies worsen mental health outcomes for oppressed groups. In relation to women’s mental health, there has been a tendency to pathologise the ways in which women individually deal with abuse or oppression rather than recognising the structural or societal causes. For example, the diagnosis of Borderline Personality Disorder (BDP) is applied predominantly to women whilst many of the traits associated with the diagnosis fit closely with gender based abuse and trauma. Men with similar manifestations of mental health outcomes are more likely to be diagnosed with post-traumatic stress disorders that recognise the underlying cause (Shaw and Proctor 2005).
The unequal burden of domestic work that academic women shoulder also takes its toll on mental health. The publish or perish dictum for academic progression together with growing administrative and teaching loads mean that women struggle more to put in the ‘extra hours’ in the evening or at weekends for research expected in academia today. Fagan et al. (2011) reviewed international evidence on working time arrangements on work-life ‘balance’ and discovered that paid employment increases the well-being of women, but those who work long hours in paid employment while retaining primary responsibility for domestic tasks at home are at particular risk of poorer mental health. A study using data from the British Household Panel Survey (BHPS) found that working hours over 49 hours a week was associated with poorer mental health for women, but not men. We would expect the effects to be intensified for women with small children. UWE’s commitment to ‘mental wealth’ means that our institution has to take the issue of workloads seriously for all, but particularly for women.
What can be done?
What is to be done? Some think the women’s behaviour change is what is needed to close the gender pay gap. For example, women need to be more assertive in demanding pay rises and promotion. Within BBS, a number of women have received support in the form of coaching to help identify goals, strategies and behaviours that would most support their achievement. UWE has established programmes in women’s leadership and there is a “women in research” mentorship programme with a high take up. There are also numerous self-help groups online and many of us form small communities of care, nurture and peer support and collaboration. Whilst these initiatives are important and help women to identify coping mechanisms and navigate the system, they do nothing to challenge the institutional structures stacked against them. What is needed is better institutional provisions to ameliorate the disproportionate burdens faced by women which could begin with making sure that women are pushed to apply for every opportunity for internal research support open to them; additional provision for early career women academics; support for women returning from maternity leave in order to catch-up on research; better maternity leave provision (with 6 weeks full pay followed by 12 weeks of half pay, UWE is amongst the least generous in UK HEIs); expanding the number of AP positions and reversing the balance of gender representation to ensure parity is reached at the professorial level in the next 5-10 years; and training on gender issues to all staff.
But more than this, we need to better understand how various forms of inequality – gender, race, class, disability, citizenship status, and religion – place workers in conditions of particular vulnerability in the workplace. This blog has focused on women academics, but many of our colleagues provide critical support for the functioning of the university in the form of admin, student support, cleaning and catering. UWE’s gender pay gap reporting does not paint a rosy picture for women and, in addition, a much deeper understanding of inequality at work is clearly needed. It is positive that BBS has taken the lead under the championing of Donna Whitehead, who is committed to the promotion of women and minorities. With the support of the faculty, a number of us are embarking on innovative research on this topic in order to strengthen UWE’s Inclusivity 2020 strategy and commitment to implementing necessary actions. We hope that in this way BBS and UWE could become the drivers of change in the sector.
A group of us in Economics have received internal funding to kick off a research project on Earning Gaps and Inequality at Work. We are interested in developing a multi-method approach to study quantitative and qualitative aspects of inequality at work. As part of this project, an expert workshop to discuss if and how we should look beyond the (gender) pay gap to understand inequality in the workplace will be held on 25th May 2018 at UWE. External participants with expertise on these themes will also be interviewed and a podcast series on inequality at work will be launched at the beginning of the new academic year.
Fagan, C., Lyonette, C., Smith, M. and Saldana-Tejeda, A. 2011. The influence of working time arrangements on work-life integration or ‘balance’: A review of the international evidence. Conditions of Work and Employment Series No. 32. Geneva: ILO.
Ginther, D. K., & Kahn, S. (2004). Women in economics: moving up or falling off the academic career ladder?. The Journal of Economic Perspectives, 18(3), 193-214.
Goldin C. (2013). Notes on Women and the Undergraduate Economics Major. CSWEP Newsletter. (Summer) :4-6, 15.
Hengel, E. (2017). Publishing while Female. Are women held to higher standards? Evidence from peer review. Retrieved from https://doi.org/10.17863/CAM.17548
Holliday, E. B., Jagsi, R., Wilson, L. D., Choi, M., Thomas Jr, C. R., & Fuller, C. D. (2014). Gender differences in publication productivity, academic position, career duration and funding among US academic radiation oncology faculty. Academic medicine: journal of the Association of American Medical Colleges, 89(5), 767.
Krefting, L. A. (2003). Intertwined discourses of merit and gender: Evidence from academic employment in the USA. Gender, Work & Organization, 10(2), 260-278.
Liff, S., & Ward, K. (2001). Distorted views through the glass ceiling: the construction of women’s understandings of promotion and senior management positions. Gender, Work & Organization, 8(1), 19-36.
Mason, M.A., Wolfinger, N.H. and Goulden, M., (2013). Do babies matter?: Gender and family in the ivory tower. Rutgers University Press.
Shaw, C. and Proctor, G. (2005). I. Women at the margins: A critique of the diagnosis of borderline personality disorder. Feminism & Psychology, 15(4), pp.483-490.
Stier, H., & Yaish, M. (2014). Occupational segregation and gender inequality in job quality: a multi-level approach. Work, employment and society, 28(2), 225-246.
Tonin, M., & Wahba, J. (2014). The sources of the gender gap in economics enrolment. CESifo Economic Studies, IZA DP No. 8414.West, J. D., Jacquet, J., King, M. M., Correll, S. J., & Bergstrom, C. T. (2013). The role of gender in scholarly authorship. PloS one, 8(7), e66212.
Winslow, S., & Davis, S. N. (2016). Gender inequality across the academic life course. Sociology Compass, 10(5), 404-416.
____________________________________________
[1] The average for higher education institutions is 15.9%, lower than the national average, as outlined in this Time Higher Education article.
[2] The rate of progress in closing the gender pay gap has been much more substantial in other higher education institutions, such as Sheffield University, where the gender pay gap reduced from32.2% in 2003 to 15.2% in 2017 – see Sheffield reporting here.
[3] Figures for gender distribution across academic grades have been put together from information available on the UWE website and may not be up to date. All personnel in management positions were counted as senior lecturers unless otherwise stated in their online staff profile.
It is now widely accepted that unless we take immediate action to reduce greenhouse gas emissions, climate change will damage our economies and societies in the next decades. But will global warming also affect the stability of the financial system?
Recent research suggests that this is a very likely outcome. For example, climate-related events, such as hurricanes, floods and typhoons, might destroy the property of households and the capital of firms, leading to a systemic rise in debt defaults. These defaults could impair the balance sheets of banks, with wider implications for the stability of the financial system. At the same time, the prices of stocks and bonds issued by companies facing climate-related losses might face declining demand by investors and might be destabilised.
But things can be even worse. If at some point in time climate policies are implemented abruptly or technology leads to a sudden shift to renewables, financial investors’ confidence in the future profitability of carbon-related sectors might be undermined. This could lead to a substantial re-valuation of the financial assets of these sectors, making them more vulnerable to defaults.
However, climate-related financial risks are not the only way through which finance and climate change are linked. There is now a lively debate about the way that central banks, commercial banks and financial markets could contribute to the transition to a low-carbon economy. Suggestions include the implementation of a green quantitative easing programme, the modification in the capital requirements of banks based on the extent to which they finance green investments and the establishment of climate-related financial disclosures. And although these potential interventions should not be viewed as substitutes for government climate policies, they might have a potentially valuable role to play in the fight against climate change.
In a workshop that we are organising at the University of Greenwich on 23 May, we will be discussing all these issues. The speakers of the event include Etienne Espagne (AFD), Rob Macquarie (Positive Money), Sini Matikainen (LSE), Hector Pollitt (Cambridge Econometrics) and ourselves. The event will be chaired by Charlotte Billingham (FEPS).
Please join us if you wish to learn more about the links between climate change and finance. Registrations can be done here.