By the researchers of the “Earnings gaps and inequality at work” project, Bristol Business School.
On 25 May 2018, UWE Economics hosted an expert workshop on ‘Beyond Pay Gaps: Inequality at Work’. Six experts were invited to share their reflections, based on their own research, on two questions:
1) What is the nature of inequality at work?
2) Is the pay gap an adequate indicator? If not, how can we improve our assessments of inequality at work?
The key aim was to foster a discussion on how to conceptualise and study inequality at work. In an earlier blog entry the workshop organisers’ provided a response to UWE’s reporting on the gender pay gap, which highlighted the fact that some progression on the gender pay gap is not in itself a sign of overall success. There are aspects of inequality at work that are captured by pay indicators and nonetheless merit our attention.
The morning session of the workshop focused on conceptualisations of inequality at work and featured the presentations of three distinguished scholars of labour and inequality. Dr Alessandra Mezzadri (SOAS University of London) drew on her long-standing research on the garment industry in India to highlight patterns of inequality and gender exploitation. Professor Bridget O’Laughlin (Institute of Social Studies) reflected on the concepts of Marx’s political economy framework as well as its conceptual gaps to study inequality at work. Professor Harriet Bradley (UWE Bristol) illustrated how a three-part conceptual framework based on production, reproduction and consumption can be used to conceptualise gender inequality at work.
In the afternoon session, three distinguished academics on gender, organisation and inequality presented on methodological approaches to study inequality at work. Dr Hannah Bargawi (SOAS University of London) discussed how a pyramid-shaped understanding of inequality at work can guide us through moving our focus between different levels of inequality. Dr Olivier Ratle (UWE Bristol) presented the qualitative methods used to study early career academics’ experience of work. Dr Vanda Papafilippou (UWE Bristol) described a range of methods from the field of sociology of education to study the workplace.
The presentations generated rich discussions on the conceptualisations of social reproduction, the complexity of inequality and the relations between the material and the cultural. The participants agreed that research on these themes is both timely and needed. Furthermore, a podcast series on ‘Feminism, Gender and the Economy’ featuring two interviews with workshop speakers will be launched in 2018/2019 academic year. Watch this space for the upcoming podcast series!
This workshop was funded by UWE Bristol. The workshop’s organisers are grateful to all participants for their thoughtful contributions and productive discussions.
There has been a lot of interest in measuring disadvantage over the past 20 years in the UK even if this has not always been matched by government responses. The fifth iteration of the English IMD is to be reviewed over the next 12 months. Clearly disadvantage is a complex thing and can be represented in many different ways. As a geographer (or someone who periodically claims to be a geographer hiding in an Economics Department) I am particularly interested in area-based assessments of disadvantage. I know such measures are problematic but what indicators are not? I recently have had the opportunity with colleagues to review how the English Indicator of Multiple Deprivation works on behalf of Power to Change (see https://www.powertochange.org.uk/) and this is a short blog that captures some of the thinking that came out of that work (any errors or misinterpretations are all my/our fault and not necessarily shared by anyone at Power to Change).
So, the English IMD is a second-generation indicator of area-based deprivation that represents 7 ‘dimensions’ (or 10 sub-dimensions if you like) of disadvantage from worklessness to housing affordability, from health (mental and physical) to distance from your nearest post office. It is ‘second generation’ because it is not solely dependent on small area census data (as ‘first generation’ indices are/were) but is based on a range of small area administrative and census data from different sources within English government.
I am a fan. It is lovely. My colleagues in other European countries are jealous of it (the basic model is oft copied) – both because of its breadth of content but also because of our lovely regular statistically ordered lower super output areas (LSOAs) that sometimes get conflated for neighbourhoods. However, an indicator is a conceptual model of a real concept. As George Box pointed out – all models are wrong, but some [of the better ones] are useful. We and Power to Change were interested in posing the question of how useful is the IMD to Power to Change?
In particular, we were interested in how the IMD is used within a particular organisational context (Power to Change). We set up a set of dimensions to help us think about how an indicator (a statistical instrument ‘designed’ to perform a task) is constructed and deployed. We asked people in Power to Change how they used the IMD and what was their assessment of the strengths and weaknesses for what they needed to do: investing in community businesses that alleviate disadvantage in England. What struck us in these conversations was that the IMD was only being used in its top-line indicator format – what was being missed was the opportunity to use the IMD as an indicator system that can be moulded to the specific objectives of an organization.
We explored how to use the IMD as a system of indicators to shine a light on a specific objective: investing in community businesses. We compared spatial targeting at LSOA level for the top-line IMD indicator (the full 7 dimensional one) with the spatial targeting from a bespoke indictor bringing together the health and disability, education and qualifications and the geographic access to services dimensions. Power to Change has hypothesised that community businesses some of which provide local services may impact on employability (skills) and on the health of residents in the communities that community business serve. So, we constructed a focussed indicator from components of the topline IMD that focused only on geographic access to services, education and health (for details see Smith et al 2018). We compared how the focussed IMD indicator would spatially target the attention of Power to Change in comparison to the top-line IMD indicator with a particular focus on the city-region of Liverpool and the County of Suffolk as examples of areas of interest for Power to Change. We then mapped out the differences (using data and shapefiles obtained under a public licence) showing firstly the map of the top-line IMD indicator, secondly showing our ‘new’ indicator focusing on Power to Change’s priorities and thirdly what difference it makes in targeting. These maps are shown in Figures 1 (for Liverpool) and Figure 2 (for Suffolk). We have used the somewhat arbitrary threshold of 30% to indicate disadvantage (the most disadvantaged areas to be targeted) and compared the indicators.
Figure 1
The left-hand side map in both Figure 1 and Figure 2 shows neighbourhoods marked relative to the top-line IMD indicator where the deepest green areas are the most disadvantaged. In the middle map the same rule applies. The right-hand map in these Figures shows what difference it makes for these areas. In this right-hand map, the red areas are those that are marked as the most disadvantaged 30% under both indicators. The blue areas are ‘advantaged’ under both measures. However, the orange areas are marked as disadvantaged under the ‘better places’ indicator but not under the top-line IMD.
Figure 2
Given the greater importance given to access to services (albeit direct distance accessibility based on 2012 data), it is not surprising that Suffolk LSOAs become more disadvantaged under this measure. Thus, nearly half of Suffolk becomes ‘disadvantaged’ on this measure (30% most disadvantaged in England on this measure) than under the top-line IMD (more of Suffolk’s third map is coloured orange). Perhaps it is of greater surprise that the prioritisation of Liverpool changes little under the new formulation. Most of Liverpool’s neighbourhoods remain identified as ‘disadvantaged’ (marked as red in the third map along).
This is however, just a schema for moving resources around. It is an inevitable result of re-calculating the target IMD measure that some areas gain whilst others lose out (where resources are fixed). However, if areas in Suffolk gain whilst neighbourhoods in Liverpool do not lose out, then how would such a change modify the geography of disadvantage [under this measure] across England? Using the 30% figure as the threshold of disadvantage just under half a million fewer people would be designated as living in a ‘disadvantaged’ area. We did some cluster analysis of the ranking on the top-line IMD indicator and our suggested Power to Change indicator considering both how LSOAs clustered together (using forms of hot spot analysis) to capture how patterns of disadvantage form broad regions and secondly, we looked at the identification of outlier neighbourhoods (using the analysis of Anselin Local Moran’s I) to capture differences within these wider clusters.
Figure 3
On Figures 3 and 4 the LSOAs that are marked as red are ones than appear as advantaged (close to other advantaged areas). In these Figures we have a left-hand map that shows the clustering of indicator ranking in relation to Suffolk. The middle map shows the Getis-Ord clustering for England as a whole whilst the right-hand map shows the Local Moran’s I maps which show where areas are located as outliers in wider regions. Where there is red there is advantage and where there is blue there is disadvantage (from an area-based perspective). Yellow areas are mixed (any area’s ranking is not easily predicted from the ranking of its neighbours). It is also worth noting that the red and the blue areas are not necessarily all of the most disadvantaged areas – just areas that are close to others that are similarly ranked (whether high or low).
Figure 4
It is not surprising to see clusters or disadvantaged (blue) areas in England’s northern metropolitan areas, in the West Midland and in the extreme South West in Figure 3 that maps out the top-line IMD indicator. It is also not surprising to see the East and
North of London marked as deep blue although it is worth noting that the former Kent Coalfield areas remain marked as disadvantaged in blue. So, it is England to the south of the Wash to Severn axis as well as North Yorkshire that are marked as ‘advantaged’ regions under the top-line IMD indicator. The Anselin outlier mapping (right hand map) in Figure 3 points out the presence of disadvantaged LSOAs in advantaged clusters and of the presence of advantaged LSOAs in disadvantaged clusters.
Moving to the Power to Change indicator in Figure 4 we see a change in the geography that might be targeted (in this case by investment in community businesses). More rural areas in the East and South West of England become identified as ‘disadvantaged’. Areas in the East and North of London no longer become identified as disadvantaged in terms of the clustering on this measure’s ranking. There is a different dynamic – to be disadvantaged area in London is to be surrounded by advantaged areas. The East of England (including Suffolk) becomes identified with the cluster of disadvantage although there are clearly still advantaged area outliers in the sea of blue disadvantaged areas. Although there are disadvantaged areas in the advantaged region of London. It has to be stressed that this applies only to forms of disadvantage that flow from combinations of problematic educational, health and accessibility outcomes. There would be a case for an organisation like Power to Change to use a form of IMD that relates specifically to their core mission as a spatial guide to targeting rather than just using the top-line IMD indicator.
The aim of the exercise is not to rubbish the general top-line IMD. I am still a fan – it is still offers useful insight into the patterns of generalised area-based disadvantage across England. The English IMD is still useful to Power to Change in a general sense. However, the aim of this has been to draw to attention the fact that deploying the indicator system in the light of what is trying to be achieved makes better use of the IMD system. The East and North of London is clearly a region with many disadvantaged areas but if the aim of the exercise is to invest in community businesses that improve access to services, health and educational outcomes, there might be better areas on which to focus this specific form of investment. Whatever form of analysis we come up with to capture disadvantage there is always a set of political choices about how to share out public spending. However, the English IMD is more than just the top-line indicator and the top-line IMD was never intended to be the only way in which area-based disadvantaged was represented.
Although in this delicate dance of spatial targeting, the real answer is to invest more in welfare services. Perhaps that is one normative step too far?
If you want to read more about our work with Power to Change, please download the report we wrote for them (available from September).
Smith, I, Green, E, Whittard, D. and Ritchie, F. (2018) Re-thinking the indices of multiple deprivation (for England): a review and exploration of alternative/complementary area-based indicator systems. Final Report. Bristol Centre for Economics and Finance (BCEF) in the Bristol Business School at the University of the West of England (UWE).
By the researchers of the ‘Earnings gaps and inequality at work’ project, BBS
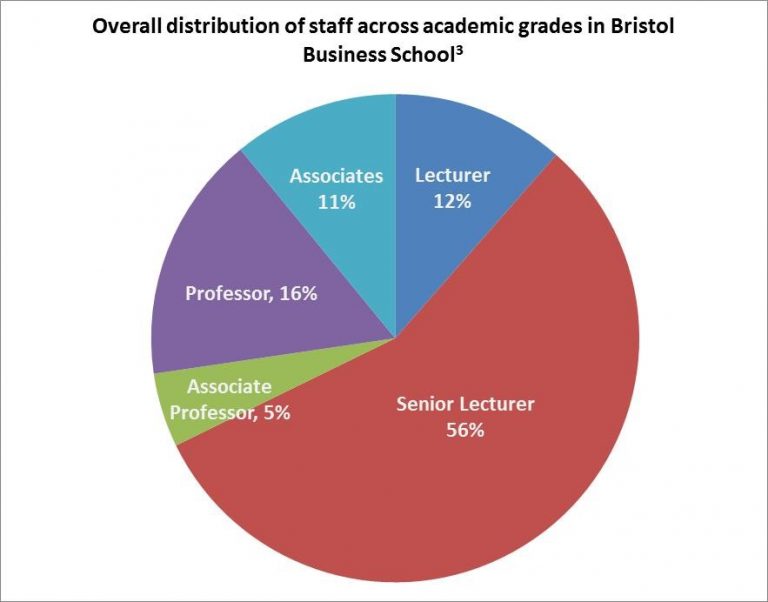
In compliance with new UK legislation, UWE Bristol published its own gender pay gap report in March 2018. Whilst recognising the need to do more to close the pay gap between women and men, that UWE achieved a gender pay gap of 13.15% has been portrayed as a sign of progress. The UWE figure is lower than the national average of 18.1% (ONS 2016)[1] and has decreased by 4.85 percentage points since 2003.[2] But if the current rate of progress is anything to go by it will be another 40 years before the gender pay gap at UWE is closed. In Bristol Business School[3] (BBS), 67% of academic staff at lecturer level and 53% at senior lecturer level are women compared with 44% and 43% at associate professor and professor levels respectively. That women are overrepresented at lower grades is not a sign of real progress, but rather that women struggle through career progression. It is then crucial to better understand what explains the gender pay gap and what actions are necessary to tackle gender discrimination at work.
Within academia, gender gaps manifest for various reasons including slower progression paths (Krefting 2003; Holiday et al. 2014; Winslow and Davis 2016). In BBS, women are well represented at the executive and management levels which might indicate specific barriers against academic promotion such as from senior lecturer to associate professor and above. A recent Times Higher Education article highlighted that one in three UK universities are going backwards on female professorships. Studies have also revealed discrimination in academic publishing. Women are less likely to push for first authorship when collaborating with men, and women authored articles face higher levels of scrutiny in the peer review processes (West et al. 2013; Hengel 2017). Women tend to apply for fewer external grants, although their success rate tends to be higher. In addition, women face disproportionate burdens in relation to career progression once they have children. Female academics face a motherhood citation penalty whilst having children appears to advantage men’s career progression. A recent study in the US showed that men with children were 35 percent more likely than women with young children to secure tenure-track positions. Men with children are also 2 percent more likely to secure these positions compared with women without children (Mason et al. 2013). There is quite some variation across disciplines in terms of gender discrimination with economics being particularly bad in terms of apparent gender imbalances in student enrolment and all the way through in academic careers (Ginter and Khan 2004; Goldin 2013; Tonin and Wahba 2014; Crawford et al. 2018).
The Gender Pay Gap is not about Equal Pay
The gender pay gap captures some of the outcomes of discrimination – for example, wage inequality, job segregation and differential progression – but it obscures others. More importantly, it tells almost nothing about the complex mechanisms via which societal norms, class, power relations, institutional structures, workplace practices, legislation, and individual attributes interact and reinforce gendered, as well as other types of discrimination. As explained in this Guardian’s video, the gender pay gap data does not reveal anything about equal pay, which is whether women and men are paid equally for the same type of job. Furthermore, research has shown that the allocation of workload, autonomy over one’s time use, the burden of pastoral care, and physical and emotional conditions of work are on average worse for women compared to male colleagues (Holliday et al. 2014; Stier and Yaish 2014). Even the ways in which women are assessed on the quality of their work are highly discriminatory. Women experience substantial negative bias in students’ assessments. Women in academia operate under workplace conditions that are stacked against them.
Inequality and mental health
There is increased understanding that inequalities within societies worsen mental health outcomes for oppressed groups. In relation to women’s mental health, there has been a tendency to pathologise the ways in which women individually deal with abuse or oppression rather than recognising the structural or societal causes. For example, the diagnosis of Borderline Personality Disorder (BDP) is applied predominantly to women whilst many of the traits associated with the diagnosis fit closely with gender based abuse and trauma. Men with similar manifestations of mental health outcomes are more likely to be diagnosed with post-traumatic stress disorders that recognise the underlying cause (Shaw and Proctor 2005).
The unequal burden of domestic work that academic women shoulder also takes its toll on mental health. The publish or perish dictum for academic progression together with growing administrative and teaching loads mean that women struggle more to put in the ‘extra hours’ in the evening or at weekends for research expected in academia today. Fagan et al. (2011) reviewed international evidence on working time arrangements on work-life ‘balance’ and discovered that paid employment increases the well-being of women, but those who work long hours in paid employment while retaining primary responsibility for domestic tasks at home are at particular risk of poorer mental health. A study using data from the British Household Panel Survey (BHPS) found that working hours over 49 hours a week was associated with poorer mental health for women, but not men. We would expect the effects to be intensified for women with small children. UWE’s commitment to ‘mental wealth’ means that our institution has to take the issue of workloads seriously for all, but particularly for women.
What can be done?
What is to be done? Some think the women’s behaviour change is what is needed to close the gender pay gap. For example, women need to be more assertive in demanding pay rises and promotion. Within BBS, a number of women have received support in the form of coaching to help identify goals, strategies and behaviours that would most support their achievement. UWE has established programmes in women’s leadership and there is a “women in research” mentorship programme with a high take up. There are also numerous self-help groups online and many of us form small communities of care, nurture and peer support and collaboration. Whilst these initiatives are important and help women to identify coping mechanisms and navigate the system, they do nothing to challenge the institutional structures stacked against them. What is needed is better institutional provisions to ameliorate the disproportionate burdens faced by women which could begin with making sure that women are pushed to apply for every opportunity for internal research support open to them; additional provision for early career women academics; support for women returning from maternity leave in order to catch-up on research; better maternity leave provision (with 6 weeks full pay followed by 12 weeks of half pay, UWE is amongst the least generous in UK HEIs); expanding the number of AP positions and reversing the balance of gender representation to ensure parity is reached at the professorial level in the next 5-10 years; and training on gender issues to all staff.
But more than this, we need to better understand how various forms of inequality – gender, race, class, disability, citizenship status, and religion – place workers in conditions of particular vulnerability in the workplace. This blog has focused on women academics, but many of our colleagues provide critical support for the functioning of the university in the form of admin, student support, cleaning and catering. UWE’s gender pay gap reporting does not paint a rosy picture for women and, in addition, a much deeper understanding of inequality at work is clearly needed. It is positive that BBS has taken the lead under the championing of Donna Whitehead, who is committed to the promotion of women and minorities. With the support of the faculty, a number of us are embarking on innovative research on this topic in order to strengthen UWE’s Inclusivity 2020 strategy and commitment to implementing necessary actions. We hope that in this way BBS and UWE could become the drivers of change in the sector.
A group of us in Economics have received internal funding to kick off a research project on Earning Gaps and Inequality at Work. We are interested in developing a multi-method approach to study quantitative and qualitative aspects of inequality at work. As part of this project, an expert workshop to discuss if and how we should look beyond the (gender) pay gap to understand inequality in the workplace will be held on 25th May 2018 at UWE. External participants with expertise on these themes will also be interviewed and a podcast series on inequality at work will be launched at the beginning of the new academic year.
Fagan, C., Lyonette, C., Smith, M. and Saldana-Tejeda, A. 2011. The influence of working time arrangements on work-life integration or ‘balance’: A review of the international evidence. Conditions of Work and Employment Series No. 32. Geneva: ILO.
Ginther, D. K., & Kahn, S. (2004). Women in economics: moving up or falling off the academic career ladder?. The Journal of Economic Perspectives, 18(3), 193-214.
Goldin C. (2013). Notes on Women and the Undergraduate Economics Major. CSWEP Newsletter. (Summer) :4-6, 15.
Hengel, E. (2017). Publishing while Female. Are women held to higher standards? Evidence from peer review. Retrieved from https://doi.org/10.17863/CAM.17548
Holliday, E. B., Jagsi, R., Wilson, L. D., Choi, M., Thomas Jr, C. R., & Fuller, C. D. (2014). Gender differences in publication productivity, academic position, career duration and funding among US academic radiation oncology faculty. Academic medicine: journal of the Association of American Medical Colleges, 89(5), 767.
Krefting, L. A. (2003). Intertwined discourses of merit and gender: Evidence from academic employment in the USA. Gender, Work & Organization, 10(2), 260-278.
Liff, S., & Ward, K. (2001). Distorted views through the glass ceiling: the construction of women’s understandings of promotion and senior management positions. Gender, Work & Organization, 8(1), 19-36.
Mason, M.A., Wolfinger, N.H. and Goulden, M., (2013). Do babies matter?: Gender and family in the ivory tower. Rutgers University Press.
Shaw, C. and Proctor, G. (2005). I. Women at the margins: A critique of the diagnosis of borderline personality disorder. Feminism & Psychology, 15(4), pp.483-490.
Stier, H., & Yaish, M. (2014). Occupational segregation and gender inequality in job quality: a multi-level approach. Work, employment and society, 28(2), 225-246.
Tonin, M., & Wahba, J. (2014). The sources of the gender gap in economics enrolment. CESifo Economic Studies, IZA DP No. 8414.West, J. D., Jacquet, J., King, M. M., Correll, S. J., & Bergstrom, C. T. (2013). The role of gender in scholarly authorship. PloS one, 8(7), e66212.
Winslow, S., & Davis, S. N. (2016). Gender inequality across the academic life course. Sociology Compass, 10(5), 404-416.
____________________________________________
[1] The average for higher education institutions is 15.9%, lower than the national average, as outlined in this Time Higher Education article.
[2] The rate of progress in closing the gender pay gap has been much more substantial in other higher education institutions, such as Sheffield University, where the gender pay gap reduced from32.2% in 2003 to 15.2% in 2017 – see Sheffield reporting here.
[3] Figures for gender distribution across academic grades have been put together from information available on the UWE website and may not be up to date. All personnel in management positions were counted as senior lecturers unless otherwise stated in their online staff profile.
It is now widely accepted that unless we take immediate action to reduce greenhouse gas emissions, climate change will damage our economies and societies in the next decades. But will global warming also affect the stability of the financial system?
Recent research suggests that this is a very likely outcome. For example, climate-related events, such as hurricanes, floods and typhoons, might destroy the property of households and the capital of firms, leading to a systemic rise in debt defaults. These defaults could impair the balance sheets of banks, with wider implications for the stability of the financial system. At the same time, the prices of stocks and bonds issued by companies facing climate-related losses might face declining demand by investors and might be destabilised.
But things can be even worse. If at some point in time climate policies are implemented abruptly or technology leads to a sudden shift to renewables, financial investors’ confidence in the future profitability of carbon-related sectors might be undermined. This could lead to a substantial re-valuation of the financial assets of these sectors, making them more vulnerable to defaults.
However, climate-related financial risks are not the only way through which finance and climate change are linked. There is now a lively debate about the way that central banks, commercial banks and financial markets could contribute to the transition to a low-carbon economy. Suggestions include the implementation of a green quantitative easing programme, the modification in the capital requirements of banks based on the extent to which they finance green investments and the establishment of climate-related financial disclosures. And although these potential interventions should not be viewed as substitutes for government climate policies, they might have a potentially valuable role to play in the fight against climate change.
In a workshop that we are organising at the University of Greenwich on 23 May, we will be discussing all these issues. The speakers of the event include Etienne Espagne (AFD), Rob Macquarie (Positive Money), Sini Matikainen (LSE), Hector Pollitt (Cambridge Econometrics) and ourselves. The event will be chaired by Charlotte Billingham (FEPS).
Please join us if you wish to learn more about the links between climate change and finance. Registrations can be done here.
When a minimum wage is set, ensuring that employees do get at least that minimum is a basic requirement of regulators. Compliance with the minimum wage can vary wildly: amongst richer countries, around 1%-3% of wages appear to fall below the minimum but in developing countries non-compliance rates can be well over 50%.
As might be expected, much non-compliance exists in the ‘informal’ economy: family businesses using relatives on an ad hoc basis, cash-only payments for casual work, agricultural labouring, or simply the use of illegal workers. However, there is also non-compliance in the formal economy. This is analysed by regulators using large surveys of employers and employees which collect detailed information on hours and earnings. This analysis allows them to identify broad characteristics and the overall scale of non-compliance in the economy.
In the UK, enforcement of the minimum wage is carried out by HM Revenue and Customs, supported by the Low Pay Commission. With 30 million jobs in the UK, and 99% of them paying at or above the minimum wage, effective enforcement means knowing where to look for infringements (for example, retail and hospitality businesses tend to pay low, but compliant, wages; personal services are more likely to pay low wages below the minimum; small firms are more likely to be non-compliant than large ones, and so on). Ironically, the high rate of compliance in the UK can bring problems, as measurement becomes sensitive to the way it is calculated.
A new paper by researchers at UWE and the University of Southampton looks at how non-compliance with minimum wages can be accurately measured, particularly in high-income countries. It shows how the quantitative measurement of non-compliance can be affected by definitions, data quality, data collection methods, processing and the choice of non-compliance measure.
The paper shows that small variations in these can have disproportionate effects on estimates of the amount of non-compliance. As a case study, it analyses the earnings of UK apprentices to show, for example, that even something as simple as the number of decimal places allowed on a survey form can have a significant effect on the non-compliance rates.
The study also throws light on the wider topic of data quality. Much research is focused on marginal analyses: looking at the relative relationships between different factors. These don’t tend to be obviously sensitive to very small variations in data quality, but that is partly because it is can be harder to identify sensitive values.
In contrast, non-compliance with the minimum wage is a binary outcome: a wage is either compliant or it is not. This makes tiny variations (just above or just below the line) easier to spot, compared to marginal analysis. Whilst this study focuses on compliance with the minimum wage, it highlights how an understanding of all aspects of the data collection process, including operational factors such as limiting the number of significant digits, can help to improve confidence in results.
Dr Rob Calvert Jump and Dr Jo Michell assess public debt accounting in this article.
In a recent tweet, George Osborne celebrated the fact that the UK now has a surplus on the government’s current budget. Osborne cited an FT article noting that “… deficit reduction has come at the cost of an unprecedented squeeze in public spending. That squeeze is now showing up in higher waiting times in hospitals for emergency treatment, worse performance measures in prisons, severe cuts in many local authorities and lower satisfaction ratings for GP services.”
It is a measure of how far the debate has departed from reality that widespread degradation of essential public services can be regarded as cause for celebration.
The official objective of fiscal austerity was to put the public finances back on a sustainable path. According to this narrative, government borrowing was out of control as a result of the profligacy of the Labour government. Without a rapid change of policy, the UK faced a fiscal crisis caused by bond investors taking fright and interest rates rising to unsustainable levels.
Is this plausible? To answer, we present alternative scenarios in which actual and projected austerity is significantly reduced and examine the resulting outcomes for national debt.
Public sector net debt (the headline government debt figure) in any year is equal to the debt at the end of the previous year plus the deficit plus adjustments,
where PSND is the public sector net debt at the end of financial year, PSNB is total public sector borrowing (the deficit) over the same year, and ADJ is any non-borrowing adjustment. This adjustment can be inferred from the OBR’s figures for both actual data and projections. In our simulations, we simply take the OBR adjustment figures as constants. Given an assumption about the nominal size of the deficit in each future year, we can then calculate the implied size of the debt over the projection period.
What matters is not the size of the debt in money terms, but as a share of GDP. We therefore also need to know nominal GDP for each future year in our simulations. This is less straightforward because nominal GDP is affected by government spending and taxation. Estimates of the magnitude of this effect – known as the fiscal multiplier – vary significantly. The OBR, for instance, assumes a value of 1.1 for the effect of current government spending. In order to avoid debate on the correct size of the nominal multiplier, we assume it is equal to zero.[1] This is a very conservative estimate and, like the OBR, we believe the correct value is greater than one. The advantage of this approach is that we can use OBR projections for nominal GDP in our simulations without adjustment.
We simulate three alternative scenarios in which the pace of actual and predicted deficit reduction is slowed by a third, a half and two thirds respectively.[2] The evolution of the public debt-to-GDP ratio in each scenario is shown below, alongside actual figures and current OBR projections based on government plans.
Fig [1]
Fig [2]
Despite the fact that the deficit is substantially higher in our alternative scenarios, there is little substantive variation in the implied time paths for debt-to-GDP ratios. In our scenarios, the point at which the debt-to-GDP ratio reaches a peak is delayed by around two years. If the speed of deficit reduction is halved, public debt peaks at around 97% of GDP in 2019-20, compared to the OBR’s projected peak of 86% in the current fiscal year. Given the assumption of zero nominal multipliers, these projections are almost certainly too high: relaxing austerity would have led to higher growth and lower debt-to-GDP ratios.
Now consider the difference in spending.
Halving the speed of deficit reduction would have meant around £10 billion in extra spending in 2011-12, £8 billion in 2012-13, £19 billion in 2013-14, £21 billion in 2014-15, £29 billion extra in 2015-16, and £37 billion extra in 2016-17. To put these figures into context, £37 billion is around 30% of total health expenditure in 2016-17. The bedroom tax, on the other hand, was initially estimated to save less than £500 million per year. These are large sums of money which would have made a material difference to public expenditure.
Would this extra spending have led to a fiscal crisis, as supporters of austerity argue? It is hard to see how a plausible argument can be made that a crisis is substantially more likely with a debt-to-GDP ratio of 97% than of 86%. Several comparable countries maintain higher debt ratios without any hint of funding problems: in 2017, the US figure was around 108%, the Belgian figure around 104%, and the French figure around 97%.
It is now beyond reasonable doubt that austerity led to increases in mortality rates – government cuts caused otherwise avoidable deaths. These could have been avoided without any substantial effect on the debt-to-GDP ratio. The argument that cuts were needed to avoid a fiscal crisis cannot be sustained.
[1] There is surprisingly little research on the size of nominal multipliers – most work focuses on real (i.e. inflation adjusted) multipliers.
[2] We calculate the actual (past years) or projected (future years) percentage change in the nominal deficit from the OBR figures and reduce this by a third, a half and two thirds respectively. The table below provides details of the middle projection where the pace of nominal deficit reduction is reduced by half.
Prof Felix Ritchie of UWE’s Business School has recently spent time with the Northern Ireland Statistics and Research Agency and makes the following analysis.
I’ve just spent two days at the Northern Ireland Statistics and Research Agency (NISRA), working with them to develop training for researchers who need access to the confidential data held by NISRA for research. This training is jointly being developed by the statistical agencies of the UK (NISRA, the General Register Office for Scotland, and the Office for National Statistics in England and Wales), as well as HMRC, the UK Data Archive and academic partners. The project is being led by ONS as part of its role to accredit researchers under the new Digital Economy Act, with UWE providing key input; other statistical agencies, such as INSEE in France and the Australian Bureau of Statistics, are being consulted and are trialling some of the material.
Training researchers in the use of confidential data is common across statistical agencies around the world, particularly when those researchers need access to the most sensitive data only available through Controlled Access Facilities (CAFs). The growth in CAFs in recent years has mostly come from virtual desktops which allow researchers to run unlimited analyses while still operating in an environment controlled by the data holder. There are now six of these in the UK, and many countries in continental Europe, North America and Oceania operate at least one. The existence of CAFs has led to an explosion in social science research as many things that were not previously allowed because it was too risky to send out data (such as use of non-public business data, or detailed personal data) have now become feasible and cost-effective.
All agencies running CAFs provide some training for researchers; around half of these use ‘passive’ training such as handouts or web pages, but the other half require face-to-face training. Much of this training has evolved from a programme developed at ONS in the UK in the 2000s and this training was recommended as an example of ‘best practice’ for face-to-face training by a Eurostat expert group.
However, this style of training is showing its age. Such training typically has two components: firstly how to behave in the CAFs and secondly how to prevent confidential data from mistakenly showing up in research outputs (‘statistical disclosure control’, or SDC). Both are typically taught mechanistically, in the form of dos and don’ts, explanations of laws and penalties and lots of SDC exercises. Overall the aim of the courses is to impart information to the researcher.
The new training is radically different from the old training. It starts from the premise that researchers are both the biggest risk and the biggest advantage to any CAF: the biggest risk because a poorly-trained or malcontented researcher can negate any security mechanism put in place; the biggest advantage because highly-motivated researchers means cheaper system design, better and more robust security and the chance for the data holder to exploit the goodwill of researchers in methodological research, for example.
In this world the main aim of the training is to encourage the researcher to see himself or herself as part of the data community. If this can be established then the rest of the training follows as a consequence. For example, knowledge of the legal environment or SDC is shared not because it keeps you out of jail but because everyone needs to understand this so the community as a whole works. This gives the course quite a different feel to more traditional courses: much of the day is spent in open-ended facilitated discussions exploring concepts of data access.
The training was designed from the ground up in order to take advantage of recent developments in thinking about data access and SDC. This was also done to avoid being restricted by having to ‘fit’ preconceived ideas about what worked or not; material was included on its own merits, not whether “this was what we used to do…”. For example, the previous SDC component had a large number of numerical examples, developed over many years, leading to attendees remarking on afternoons spent “doing Sudoku”. We reviewed every example to identify the minimum set of principles needing to be explored and then wrote a small number of new examples based on this minimum set. On the other hand, the previous training had relatively little to say about the context for checking outputs for confidentiality breaches; this has now been expanded as it fits with the ethos of understanding why things are done.
Of course, this was not all plain sailing. The original structure, trialled in June 2017, had just one presentation before being comprehensively abandoned. Modules have dropped in and out and been moved around. The initial test for the course has been completely rewritten (a topic for a later blog). Various sections have been inserted as ‘options’ to take account of regional variations in operating practices. Throughout this, multiple organisations have been able to feed into the process so that the final product itself has a sense of community ownership.
We are now at the stage of training-the-trainers to enable independent delivery around the UK. This is already generating much feedback for the future development of the course: for example, a need has arisen for ‘crib sheets’ to help in the facilitation of certain exercises. Overall, however, we are confident that we have a well-structured, informative, course that meets the needs of 21st century data training.
Further reading: for more information on the evidential and conceptual basis for the course, see Ritchie F., Green E., Newman J. and Parker T. (2017) “Lessons Learned in Training ‘Safe Users’ of Confidential Data“. UNECE work session on Statistical Data Confidentiality 2017. Eurostat.
Dr Tim Hinks, Senior Economics Lecturer at UWE, in conjunction with fellow academics Joe Devine and Arif Naveed have published this paper in the Journal of Happiness Studies
Abstract Research into the relation between religion and happiness offers inconclusive evidence. Religion seems to matter but it is not entirely clear how and why. Moreover much of the research to date is rooted in western experiences. This article analyzes primary data from Bangladesh to examine how religion figures in people’s wellbeing and life chances. It identifies differences in reported happiness between the country’s two largest religious populations: Muslims and Hindus. Our main argument is that the significance of religion is only really understood when considered alongside social, economic and political processes. The data and analysis make an important contribution to the limited knowledge we have of the relation between religion, political connectedness and happiness in non-western societies. It also highlights the need to incorporate more contextualizing analyses into our assessments of the relation between religion and happiness.
Introduction 1.1 Religion and Wellbeing Academic interest in the connection between religion and happiness has grown significantly over recent years, and produced an impressive body of scholarship. Many studies demonstrate a positive association between religion and happiness. The significance of this association should not be underestimated. For example Witter et al. (1985) reviewed 28 wellbeing studies and found that the majority reported a positive association between religion and subjective wellbeing. Moreover they found that religion accounted for 2–6% of the variation in subjective wellbeing. Ellison et al. (1989) went one step further arguing that the effect of religion on subjective wellbeing is as strong if not stronger than income. This finds some support in Luttmer’s claim that religion is positively correlated with measures of subjective wellbeing even when demographic variables such as income, age and marital status are taken into account (Luttmer 2005).
In what ways then does religion make us happy? The evidence offered by the literature falls broadly into two categories, reflecting a distinction first introduced by Allport and Ross’s (1967) pioneering work into religious orientation. According to Allport and Ross, people have intrinsic or extrinsic motivations in relation to religion. The latter sees religion as a means to achieve particular goals including non-religious ones while the former is autonomous and considers religion as an end in itself. Although this distinction is not without its critics (see Lavrič and Flere 2007), it has left its mark on research into religion and happiness. On the one hand therefore it is argued that religion enhances wellbeing because it offers access to support structures or enables individuals to cope with stress (Lim and Putnam 2010), or to adapt preferences or aspirations (Clark 2012). On the other hand, religion enhances wellbeing because it offers a sense of meaning and purpose, and acts as a moral compass in this as well as the ‘after-life’ (Greeley and Hout 2006). What is striking however is that we can find evidence of both intrinsic and extrinsic benefits of religion in all of the world’s major religions including Islam (Sahraian et al. 2013), Hinduism (Ganga and Kutty 2013), Judaism (Levin 2014), Buddhism (Elliot 2014), and Christianity (Steiner et al. 2010). Although the effects of religion on wellbeing are generally reported as being positive, there are important counter observations. First, religion may also be a factor in producing negative wellbeing values. Ellis (1962) for example reports that excessive religion can produce depression and mental disorders. More recently, Mookerjee and Beron’s cross country analysis of the relation between religion and happiness concluded that contexts with high levels of religious fractionalisation produce relatively lower levels of happiness (Mookerjee and Beron 2005). Second, much of the literature draws conclusions on the effects of religion from studies that focus entirely on individual level processes. As such the context is overlooked. Some recent work has warned of the dangers of this approach arguing that positive individual level effects disappear when contextualised with a country’s overall level of religiosity (Eichhorn 2012). Third, it is important to acknowledge the bias in the literature towards religious experiences and contexts in the West with relatively little attention being paid to non-western contexts where the parameters of any discussion about religion and wellbeing may be radically different (Joshanloo 2013, 2014). Finally, most of the literature rests on an assumption about the direction of causality. Thus it is assumed that religion leads to happiness as opposed to happiness leading to religion.
1.2 Religion and Wellbeing in Bangladesh Our research focuses on the relation between religion and wellbeing in Bangladesh, and as such contributes to the nascent scholarship focusing specifically on wellbeing in countries of the Global South (Diener et al. 2013; Shams 2016). Bangladesh is a particularly appropriate location in which to examine wellbeing dynamics since it throws up a number of wellbeing puzzles which all reflect different aspects of the Easterlin paradox (Easterlin 1974). Thus in the 1990s, Bangladesh reported higher levels of happiness than many other countries, including the UK, where people enjoy significantly larger per capita incomes and access to a wider range of basic services and good (Worcester 1998). Since the 1990s, the country has made significant progress in reducing poverty and introducing socio-economic improvements (Devine and Wood 2017), and can be described as a global international development success story. Despite this however, levels of reported happiness seem to be declining (Asadullah and Chaudhury 2012). Improved living standards therefore seem to be having an impact upon the wellbeing expectations and demands of its citizens (Diener et al. 2013).
The early years of state formation in Bangladesh were anchored in a very clear commitment to secularism, and indeed early writings on religion, most notably Islam, emphasised its syncretic and malleable qualities (Uddin 2006). However since the early 1990s, a different expression of religion has emerged which has been described as neo-orthodox, militant, and extremist (Riaz 2004). These changes reflect deeper questions about what constitutes ‘proper’ Islam in Bangladesh and also what constitutes a ‘Muslim democracy’ (Devine and White 2013). The unresolved nature of these questions is etched visibly in the relations between the dominant Muslims and followers of other religions in the country. Muslims in Bangladesh constitute around 87% of the population. While the remaining 13% belong to a number of different religions, Hinduism is by far the largest minority religion in the country.
In Bangladesh religion is directly translated as dharma, a term which derives from the Sanskrit dhr meaning to sustain, support or uphold (Mahony 1987). However dharma means more than just ‘religion’, at least as understood in the West. Etymologically, dharma refers to the ‘proper cosmo-moral ordering’ of things (Inden 1985). In this sense, everything that exists, animate or inanimate, has its dharma. Even religion has its own dharma. Second, the word dharma is used in everyday speech to ask about one’s religion. So it is quite common in Bangladesh to ask: ‘apnar dharma ki?’, i.e. what is your religion?. The response to this question however reveals two things. First, it communicates a person’s religious affiliation. Second, the declaration of a religious affiliation or identity provides important implicit information on which social groups you belong to and can interact with; what practical lifestyle choices you can or cannot make; what constitutes appropriate behaviour and conduct; what aspirations you might have; who you can marry, what food you can eat, and so forth (Kotalova 1993). Dharma therefore is as much about everyday practical choices and opportunities as it is about religious affiliation.
There is very little literature on the relation between religion and wellbeing in Bangladesh. The founding research projects which inform this paper,1 found statistically significant correlations between religion and happiness, especially among older respondents (Camfield et al. 2009). In more qualitative follow-up research, we identified a number of areas where the influence of religion on wellbeing comes to the fore including the structuring of community relations (Devine and White 2013), responsibilities, obligations and expectations around marriage, gender and intergenerational relations (White 2012), and the development of political culture and democracy (Basu et al. 2017).
Recently Asadullah and Chaudhury (2012) offer a very different argument. Analysing data from 2400 households across 12 districts in Bangladesh, the authors claim that neither religion nor gender had any significant impact on happiness. Instead they found that the influence of inter-personal relations and social trust on happiness was statistically significant. This opens up a new avenue into an equally under-researched area, i.e. trust. The only study on trust we could identify was Gupta et al’s (2013) comparative analysis of the behaviour of Muslims and Hindus in Bangladesh and West Bengal in India. In the latter, Hindus constitute the majority group and Muslims the minority; whilst in the former, the opposite is true. In both sites, the authors found that identity based on status (i.e. being a member of the majority or minority group) rather than religion per se determined levels of trust and trustworthiness. We return to this finding in our Sect. 3 below.
Our research makes three important contributions. First, to the best of our knowledge, the findings presented here are the first to quantitatively look at the impact of religious identity on people’s self-reported happiness in Bangladesh. Second, given that the analysis is anchored in Bangladesh our research offers an important contribution to a literature that is dominated by Western experiences and understandings of religion. Finally, the article contributes to the growing but still relatively thin literature on wellbeing and happiness in the Global South.